Why Profiling and What to Profile?
Last week we showed how we sped up Acunote (our agile project management application) using memory profiling. That was the fish -- you can apply patches from that article and likely get nice boost for your app (we got 5x). Today we give you the net and show how to identify performance and memory usage bottlenecks in your Ruby/Rails application.
Profiling performance and memory separately dramatically simplifies optimizing ruby code, and turns it into a deterministic profile/fix/go-faster/repeat loop, rather than (profile or guess)/fix/(get disappointed)/(get discouraged) loop it was before. Read on to learn how.
Preparations And Tools
First, get Ruby 1.8.6 sources, patch them, compile and install. Ruby 1.8.5 will work the same patch too. Vanilla Ruby GC doesn't give us enough information, hence the need for a patch (composed from Sylvain Joyeux's memory allocations patch, Stefan Kaes' Railsbench GC patch, and my own memory counter; the patch applies to both Ruby 1.8.5 and 1.8.6). It's a good idea to install patched Ruby into its own prefix (say, configure --prefix=~/bin/ruby) and to adjust the $PATH every time you need to profile.
Second, install the recently released ruby-prof 0.6.0. gem install ruby-prof or gem update ruby-prof should do the job. ruby-prof 0.5.2 does not have the memory profiler we'll need, but you can patch it if you really need to. It is important to have and use patched ruby before you start installing ruby-prof gem, otherwise installed gem will not have support for memory profiling compiled in.
Measure/Benchmark
Before profiling you need to measure the current state. Forget about Rails logger and request time recorded there. You need information about:
- request time;
- size of memory allocated during the request;
- number of objects allocated during the request;
- number of GC collections;
- time spent in GC.
To get request time we'll use Benchmark.realtime {} The get memory use and GC stats we'll use this helper:
#Executes block and collects GC statistics during the block execution.
#Collected stats are printed to stdout (or to the file set in $RUBY_GC_DATA_FILE env var):
# - allocated memory size (in KB) during block execution
# - number of memory allocations during block execution
# - number of GC collections during block execution
# - time (in milliseconds ) spent in GC
#
#Description string appears in stdout before statistics
#Options are
# - :disable_gc => true    - disables GC during execution
# - :show_gc_dump => true  - shows GC heap dump after statistics
def gc_statistics(description = "", options = {})
    #do nothing if we don't have patched Ruby GC
    yield and return unless GC.respond_to? :enable_stats
<span class="no">GC</span><span class="p">.</span><span class="nf">enable_stats</span> <span class="o">||</span> <span class="no">GC</span><span class="p">.</span><span class="nf">clear_stats</span>
<span class="no">GC</span><span class="p">.</span><span class="nf">disable</span> <span class="k">if</span> <span class="n">options</span><span class="p">[</span><span class="ss">:disable_gc</span><span class="p">]</span>

<span class="k">yield</span>

<span class="n">stat_string</span> <span class="o">=</span> <span class="n">description</span> <span class="o">+</span> <span class="s2">": "</span>
<span class="n">stat_string</span> <span class="o">+=</span> <span class="s2">"allocated: </span><span class="si">#{</span><span class="no">GC</span><span class="p">.</span><span class="nf">allocated_size</span><span class="o">/</span><span class="mi">1024</span><span class="si">}</span><span class="s2">K total in </span><span class="si">#{</span><span class="no">GC</span><span class="p">.</span><span class="nf">num_allocations</span><span class="si">}</span><span class="s2"> allocations, "</span>
<span class="n">stat_string</span> <span class="o">+=</span> <span class="s2">"GC calls: </span><span class="si">#{</span><span class="no">GC</span><span class="p">.</span><span class="nf">collections</span><span class="si">}</span><span class="s2">, "</span>
<span class="n">stat_string</span> <span class="o">+=</span> <span class="s2">"GC time: </span><span class="si">#{</span><span class="no">GC</span><span class="p">.</span><span class="nf">time</span> <span class="o">/</span> <span class="mi">1000</span><span class="si">}</span><span class="s2"> msec"</span>

<span class="no">GC</span><span class="p">.</span><span class="nf">log</span> <span class="n">stat_string</span>
<span class="no">GC</span><span class="p">.</span><span class="nf">dump</span> <span class="k">if</span> <span class="n">options</span><span class="p">[</span><span class="ss">:show_gc_dump</span><span class="p">]</span>

<span class="no">GC</span><span class="p">.</span><span class="nf">enable</span> <span class="k">if</span> <span class="n">options</span><span class="p">[</span><span class="ss">:disable_gc</span><span class="p">]</span>
<span class="no">GC</span><span class="p">.</span><span class="nf">disable_stats</span>
end
I personally find it Zen to create a special kind of integration tests for benchmarks (let's call them "performance tests").
Using gc_statistics helper a performance test can look like this:
class PostsPerformanceTest < ActionController::IntegrationTest
    def test_index
        puts "posts/index:"
        benchmark_time :get, 'posts/index'
        benchmark_memory :get, 'posts/index'
    end
<span class="k">def</span> <span class="nf">benchmark_time</span><span class="p">(</span><span class="nb">method</span><span class="p">,</span> <span class="n">url</span><span class="p">)</span>
<span class="n">measured_times</span> <span class="o">=</span> <span class="p">[]</span>
<span class="mi">10</span><span class="p">.</span><span class="nf">times</span> <span class="p">{</span> <span class="n">measured_times</span> <span class="o"><<</span> <span class="no">Benchmark</span><span class="p">.</span><span class="nf">realtime</span> <span class="p">{</span> <span class="nb">send</span><span class="p">(</span><span class="nb">method</span><span class="p">,</span> <span class="n">url</span><span class="p">)</span> <span class="p">}</span> <span class="p">}</span>
<span class="nb">puts</span> <span class="s2">"time: </span><span class="si">#{</span><span class="n">mean</span><span class="p">(</span><span class="n">measured_times</span><span class="p">).</span><span class="nf">to_02f</span><span class="si">}</span><span class="s2"> ± </span><span class="si">#{</span><span class="n">deviation</span><span class="p">(</span><span class="n">measured_times</span><span class="p">).</span><span class="nf">to_02f</span><span class="si">}</span><span class="se">\n</span><span class="s2">"</span>
<span class="k">end</span>
<span class="k">def</span> <span class="nf">benchmark_memory</span><span class="p">(</span><span class="nb">method</span><span class="p">,</span> <span class="n">url</span><span class="p">)</span>
<span class="n">gc_statistics</span><span class="p">(</span><span class="s2">"memory: "</span><span class="p">)</span> <span class="p">{</span> <span class="nb">send</span><span class="p">(</span><span class="ss">:method</span><span class="p">,</span> <span class="n">url</span><span class="p">)</span> <span class="p">}</span>
<span class="k">end</span>
<span class="k">def</span> <span class="nf">mean</span><span class="p">(</span><span class="n">values</span><span class="p">)</span>
<span class="n">values</span><span class="p">.</span><span class="nf">sum</span> <span class="o">/</span> <span class="n">values</span><span class="p">.</span><span class="nf">length</span>
<span class="k">end</span>
<span class="k">def</span> <span class="nf">deviation</span><span class="p">(</span><span class="n">values</span><span class="p">)</span>
<span class="n">m</span> <span class="o">=</span> <span class="n">mean</span><span class="p">(</span><span class="n">values</span><span class="p">)</span>
<span class="no">Math</span><span class="p">.</span><span class="nf">sqrt</span><span class="p">(</span><span class="n">values</span><span class="p">.</span><span class="nf">inject</span><span class="p">(</span><span class="mi">0</span><span class="p">){</span><span class="o">|</span><span class="n">sum</span><span class="p">,</span> <span class="n">a</span><span class="o">|</span> <span class="n">sum</span> <span class="o">+</span> <span class="p">(</span><span class="n">a</span> <span class="o">-</span> <span class="n">m</span><span class="p">)</span><span class="o">**</span><span class="mi">2</span><span class="p">}</span> <span class="o">/</span> <span class="n">values</span><span class="p">.</span><span class="nf">length</span><span class="p">)</span>
<span class="k">end</span>
end
Sample output from such test will look like:
posts/index:
time: 3.50 ± 0.01
memory: allocated: 150246K total in 1650700 allocations, GC calls: 19, GC time: 1500 msec
The results as in example output above suggest optimizing memory first because it's possible to save more than a second by producing less garbage and doing less garbage collections (19 is too much). My experience in optimizing Rails apps tells that normally you should aim at 1-2 GC calls per request and ideally you can get no GC collections at all. Of course, some long requests may inevitably use more memory but the rule of thumb is: less GC collections is better.
How to Profile
Profiling with ruby-prof is very similar to measurements we've seen above. Integration tests again become the Zen way to profile (let's call them "profiling tests").
Profiling test should:
- run ruby-prof to generate processing time profile;
- run ruby-prof to generate memory profile;
- output profiling results in a suitable format (preferably, calltree).
For example, profiling test can look like this:
require 'ruby-prof'
class PostsController alias :index_orig, :index def index RubyProf.start index_orig result = RubyProf.stop
<span class="n">measure_names</span> <span class="o">=</span> <span class="p">{</span> <span class="no">RubyProf</span><span class="o">::</span><span class="no">MEMORY</span> <span class="o">=></span> <span class="s1">'memory'</span><span class="p">,</span> <span class="no">RubyProf</span><span class="o">::</span><span class="no">PROCESS_TIME</span> <span class="o">=></span> <span class="s1">'time'</span> <span class="p">}</span>
<span class="n">printer</span> <span class="o">=</span> <span class="no">RubyProf</span><span class="o">::</span><span class="no">CallTreePrinter</span><span class="p">.</span><span class="nf">new</span><span class="p">(</span><span class="n">result</span><span class="p">)</span>
<span class="n">printer</span><span class="p">.</span><span class="nf">print</span><span class="p">(</span><span class="no">File</span><span class="p">.</span><span class="nf">open</span><span class="p">(</span><span class="s2">"callgrind.out.posts_index_</span><span class="si">#{</span><span class="n">measure_names</span><span class="p">[</span><span class="no">RubyProf</span><span class="o">::</span><span class="n">measure_mode</span><span class="p">]</span><span class="si">}</span><span class="s2">"</span><span class="p">,</span> <span class="s1">'w'</span><span class="p">))</span>
<span class="k">end</span>
end
class PostsProfilingTest < ActionController::IntegrationTest def setup GC.disable end def teardown GC.enable end
<span class="k">def</span> <span class="nf">test_index</span>
    <span class="n">profile</span> <span class="ss">:get</span><span class="p">,</span> <span class="s1">'posts/index'</span>
<span class="k">end</span>

<span class="k">def</span> <span class="nf">profile</span><span class="p">(</span><span class="nb">method</span><span class="p">,</span> <span class="n">url</span><span class="p">)</span>
    <span class="no">RubyProf</span><span class="p">.</span><span class="nf">measurement_mode</span> <span class="o">=</span> <span class="no">RubyProf</span><span class="o">::</span><span class="no">PROCESS_TIME</span>
    <span class="nb">send</span><span class="p">(</span><span class="nb">method</span><span class="p">,</span> <span class="n">url</span><span class="p">)</span>
    <span class="no">RubyProf</span><span class="p">.</span><span class="nf">measurement_mode</span> <span class="o">=</span> <span class="no">RubyProf</span><span class="o">::</span><span class="no">MEMORY</span>
    <span class="nb">send</span><span class="p">(</span><span class="nb">method</span><span class="p">,</span> <span class="n">url</span><span class="p">)</span>
<span class="k">end</span>
end
Note that we do 2 separate profiler runs, one for PROCESS_TIME and one for MEMORY. That's because the profiler only supports measuring one thing at a time.
There are a few more things to note. The code disables GC for the time of request. Otherwise ruby-prof attributes full time cost of garbage collection to the method where GC gets triggered, not the methods that allocate the memory. For profiling we need deterministic behavior without GC. See original article for more info on this.
Second, the test records profiler information only for controller action. There's no point in profiling Rails integration testing framework and GCI dispatcher when we need to profile only our application.
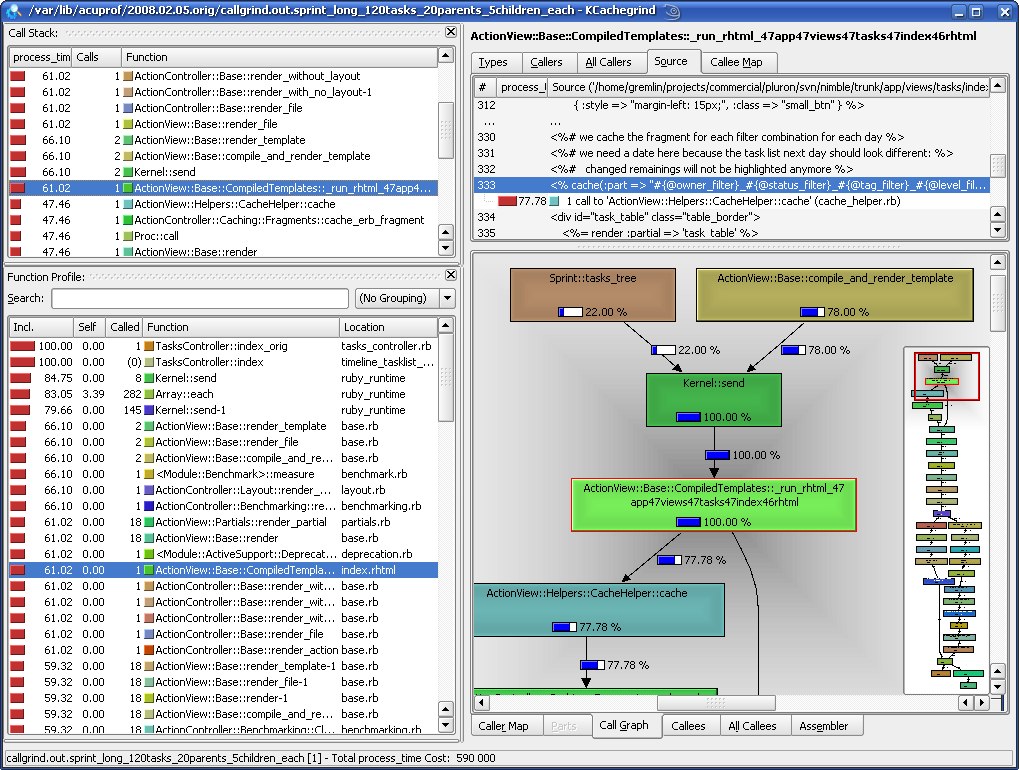
Finally, and most importantly, the code outputs results in the calltree format for use with excellent KCachegrind profiler data visualization tool by Josef Weidendorfer.
Using KCachegrind
With KCachegrind you get all the goodies:
- the list of methods sortable by both their total time and self time;
- call graph visualization;
- easy access to callers and callee's of any given function;
- cycle detection in the code;
- profiler-annotated source code listings;
- more stuff like search, relative and percentage cost calculations, etc.
In short, with KCachegrind it is much easier to understand profiler output compared with using plain text and HTML formatted ruby-prof results. I guess the example screenshot below will be the best proof of that.
KCachegrind is a part of KDE kdesdk distribution. Linux'ers should not have any troubles installing it. On MacOS X you can install KCachegrind from either MacPorts with port install kcachegrind or from Fink. In both cases Apple X11 is necessary. Those who still are on Windows may try installing KCachegrind from KDE-Cygwin or resort to WinCacheGrind or even to HTML output.
By this point you should get all the data and only a few simple things left to do. KCachegrind's function profile sidebar will show you which methods took long to execute and which methods ate the memory. Call stack sidebar and call tree will show you where those methods are called from. Source listing will help you to traverse the call tree and locate hotspots. This is all you need to understand where you app is slow and where it eats lots of memory.
Next step is to fix these problems.
How to Optimize
Unlike profiling, optimization is not deterministic and there's no universal recipe on how to fix the slowdowns. There're some common tricks and although they are off topic here, I'll give you some most important ones:
- look for
Kernel#clonein profiler and fix your code - never clone objects; - do not use
ActiveRecord::Base::attributesmethod, it clones attributes; - don't use named block parameters when you can, replace
def myfun(&block)declarations withdef myfun; - avoid stuff with O(n2) performance like
acts_as_listand be careful withacts_as_treeas well; - execute fewer queries, especially with ActiveRecord;
- don't use
link_to_function,text_field_tag,check_box_tagandimage_tagif you can; - preload objects with
:include => ''find parameter where possible; - don't render too many partials.
Complete explanation of the hints is well worth the separate blog post, but that's for the future.
Optimize Today!
I hope you'll enjoy profiling and optimizing your application like I did. This is a greatly rewarding work, in some cases I got 5x improvements using the techniques described above. Some of the findings (including Ruby and Rails optimizations) are described in two previous blog posts:
Guerrilla's Guide to Optimizing Rails Applications
Garbage Collection is Why Ruby on Rails is Slow: Patches to Improve Performance 5x; Memory Profiling
In any case, if you have your own suggestions or improvements to the method, optimization tricks, please share them. I'll post them here.